

Mobile application retention rate challenges.
Retention rate (RR) is a rather important indicator, that measures how a user is engaged with a particular mobile application and shows the user who keeps using the mobile application and who does not. If a user downloads the app but does not refer to it the next day, it is considered as «drop-off». Usually, the retention rate measure is applied to exact time periods, like 1, 7, 21, 30 days;
We at Khing (by TimeOne) consider the importance of measuring a RR because of two reasons:
- Retention rate demonstrates to what extent users are “satisfied” with the app, which is the indicator of how great the application achieves its purposes of creation;
- Retention rate allows measuring approximate use of the application by each user in order to count rough profit gained per user.
According to the recent research, the average mobile app retention is concentrated around 20% in 90 days. This means that another 80% of mobile users drop off within 90 days. So it is obviously important to maximize the engagement of your mobile application within your users to keep it visited by them.
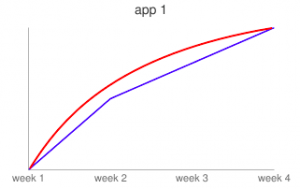
Imagine you have two mobile applications and one million pounds which you can invest in them. Let’s analyse the performances of those apps over a month.
![]()
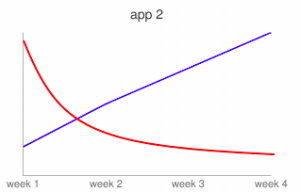
The 1st application is confidently increasing the number of its active users for the account of installs that raised because of spending on advertising. At the same time, the 2nd application is increasing the active users despite the fact that the number of new installs is declining, so it is increasing because of old retentive users. This means that the 2nd application has a higher RR and more potential for acquiring organic users. In other words, the 2nd application has characteristics and features that help to engage users making them share the app with other people.
So, I would invest my million into the 2nd application, and you?
Let’s investigate the RR data of 2016 per app category to understand what rates to expect.
1. Social and entertainment applications showed the highest rates of users engagement. Such as, people spent about an average of an hour in social media apps, launching them about 20 times per month. Although the average RR after 3 months was 83%, only 42% returned to social app more than 11 times. In terms of entertainment apps, people spent about 103 minutes per month, launching them about 15 times. In this case, average RR after 3 months reached 79%.
2. Applications of business, technology, travel and lifestyle apps demonstrated lower rates of retention with 13 launches per month on average. Business and technology apps showed about 51 minutes time spent on them while traveling and lifestyle apps – 47 minutes. In addition, after 3 months only 20% continued using business or technology application, while it is 75% in case of travel and lifestyle applications.
3. In terms of retail and eCommerce applications, RR after the first month has reached 59%, although 21% of users opened the application of this category only once with about 38 minutes spent per month.
To sum up, to be able to compete and win more users for your mobile application, you should always understand that engagement as well as retention of the app is closely associated with app category and compare your application with similar apps to investigate if the app needs upgrades to be able to involve more users and increase their engagement.